
A purpose-built system for capturing, analysing, and comparing mechanical impact events using high-speed data acquisition and FFT-based signal processing
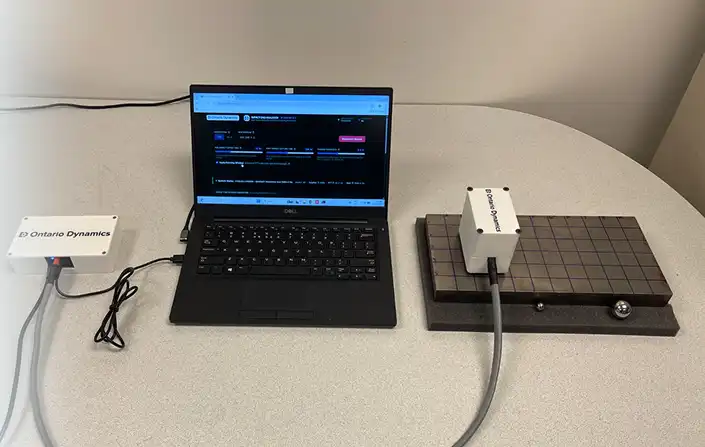

Ontario Dynamics developed a controlled impact detection test bench that captures the full vibration signature of a mechanical impact, from pre-impact baseline through to decay, and computes the frequency response automatically on each capture.
Pre-Impact Capture
Circular buffer retains baseline data before the trigger fires
Impact Comparison
Three different impact objects tested and compared on the same specimen
Bounce Detection
Secondary contact events visible as separate events in the time-domain waveform
Confidential
Mechanical testing and vibration analysis
Custom impact detection test bench for controlled mechanical impact measurement and frequency response analysis
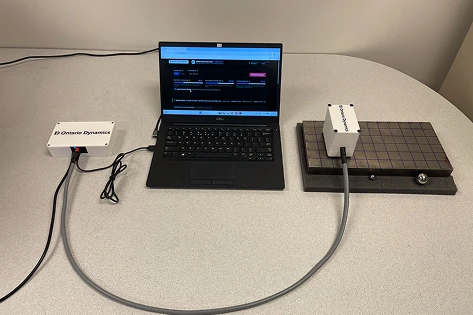
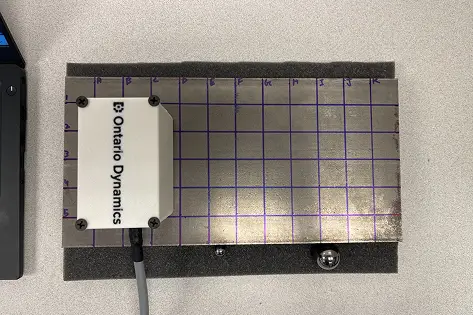
Ontario Dynamics developed this impact detection test bench to capture, analyze, and compare mechanical impact events on a test specimen.
The need was straightforward.
In many mechanical testing applications, the impact event itself is the input that matters. The type of object used, the energy it delivers, how long it stays in contact, how the specimen is supported, all of it affects what the structure does next. Without a controlled way to measure those differences, engineers are comparing results without a reliable basis for comparison.
Ontario Dynamics was asked to build a system that solved this. The result was a complete test bench combining dual-accelerometer data acquisition, circular buffer pre-trigger capture, FFT-based frequency analysis, and a laptop dashboard that engineers could operate directly from the test setup.
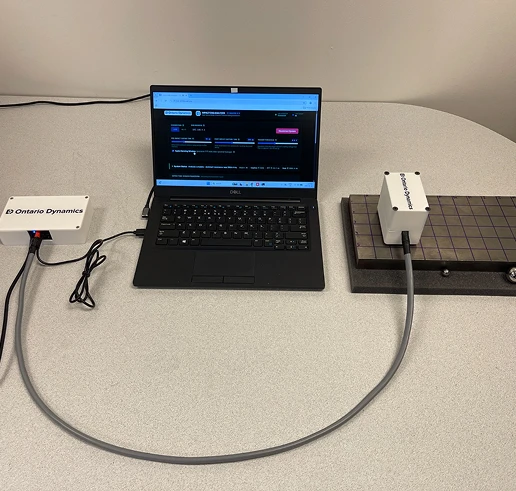
The system needed to do more than record vibration. It had to capture the full impact event, trigger reliably on real impacts without false fires, and give engineers enough information to compare different impact inputs under controlled conditions.
Area
Function
Detection Channel
Monitors for valid impact events and fires the trigger
Recording Channel
Runs continuously through high-speed ADC, stored in circular buffer
Dashboard
Displays captured waveform and computed FFT response after each impact
The recording and detection channels had to operate independently. If the same accelerometer handled both jobs, a strong impact could saturate the recording signal at the exact moment the trigger needed to fire.
Ontario Dynamics used a dual-accelerometer arrangement to keep the two functions separate. The detection accelerometer monitored for impact events. The recording accelerometer ran continuously through a dedicated high-speed analog-to-digital conversion stage placed close to the sensor.
The dashboard had to read the trigger event, lock in the circular buffer data, compute the FFT, and display the result, all without requiring the engineer to do anything between impacts.
The client needed a platform for comparing mechanical impact inputs on the same test specimen. That sounds simple. In practice, several things made it difficult.
Impact events happen in milliseconds. A system that only starts recording after the trigger fires will always miss the earliest part of the impact, the part that often contains the most relevant information. Standard data acquisition setups do not solve this out of the box.
The client also needed the system to work across different impact objects. Different contact geometries and sizes produce different frequency content, but those differences are only meaningful if the test conditions are otherwise identical. The system had to make that kind of controlled comparison possible.
Low-level handling vibration could cause false triggers and corrupt the data:
Replacing the presses would have been expensive. A large standard automation package would also entail additional costs, downtime, and integration work.
The client needed a smarter retrofit.
The project had several practical challenges:
“This was not only a data acquisition project. It was an impact measurement challenge where the trigger moment, the capture window, and the signal chain all had to work together to capture something that lasts a few milliseconds.”
ENGINEERING CONCLUSION
Ontario Dynamics designed the impact detection test bench as a complete system, hardware, acquisition, and dashboard integrated from the start.
The solution was built around three main layers: strategy, implementation, and technology.
The approach centred on separating detection from recording, capturing data before the trigger rather than after it, and computing the frequency response automatically so engineers could focus on comparing results rather than processing data.
One accelerometer dedicated to detection. One accelerometer dedicated to recording. The detection channel identified valid impacts and fired the trigger. The recording channel ran continuously, fed into a circular buffer, and was locked in the moment the trigger fired. This kept the two functions independent and prevented the impact signal from interfering with the trigger event.
The high-speed analog-to-digital conversion stage was placed close to the recording accelerometer. This kept the analog signal path short before digitisation and reduced noise pickup on the recording channel.
The test specimen, sensor mounting position, impact method, and all dashboard parameters could be adjusted for different test conditions without changing the core system. This made it practical to run controlled comparisons across different impact inputs on the same specimen.
Impact objects, specimen support conditions, and sensor locations could all be swapped between tests without any modification to the data acquisition hardware or dashboard configuration.
The recording accelerometer was sampled continuously. The data was held in a circular buffer so that when the trigger fired, the system could look back and preserve a selectable window of pre-impact data.
This meant the full impact signature was available, pre-impact baseline, initial strike, vibration decay, not just the response after the trigger.
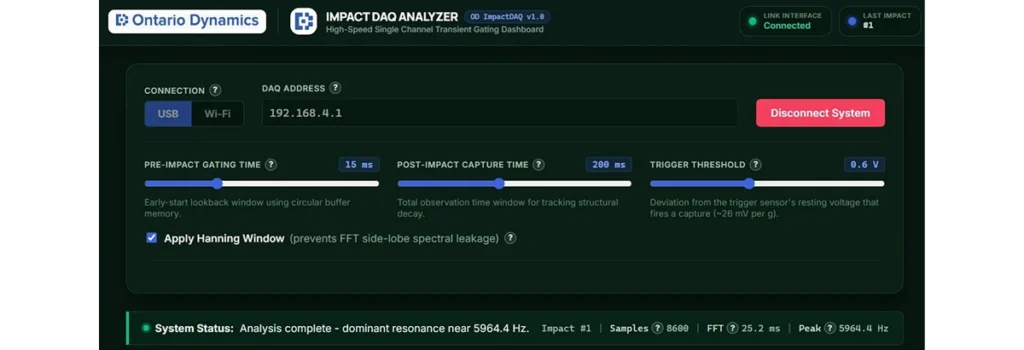
The trigger threshold was set by the engineer through the dashboard. It defined the voltage deviation required from the detection accelerometer before the system classified an event as a valid impact.
This allowed the system to reject low-level disturbance, handling vibration, background noise, incidental contact with the plate, without missing real impact events.
After the trigger fired, the system continued recording for a selectable post-impact duration. This gave engineers control over how much of the vibration decay was captured and analysed.
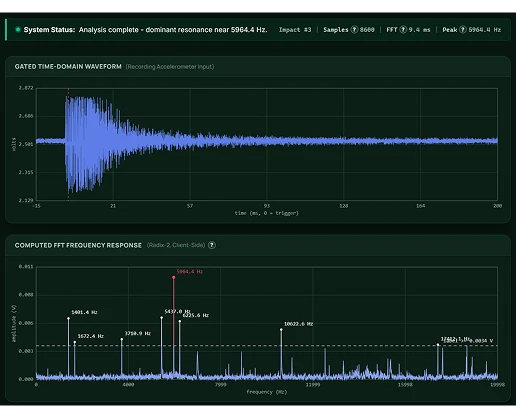
After each capture, the dashboard computed the FFT frequency response from the recorded waveform. The dominant frequency peak was identified and displayed automatically. Engineers could review both the time-domain waveform and the frequency response for every impact without any manual processing step.
Technology
Dual-Channel Data Acquisition
The system used a microcontroller-based data acquisition controller connected to both accelerometer channels. The detection channel fed the trigger input. The recording channel fed the high-speed ADC. The controller communicated with the laptop dashboard over USB or Wi-Fi.
The laptop dashboard displayed: system connection status, impact number, number of captured samples, FFT calculation time, dominant frequency peak, gated time-domain waveform, computed FFT frequency response, and optional Hann windowing control.
Three parameters were adjustable directly from the dashboard: pre-impact gating time, post-impact capture time, and trigger threshold.
Radix-2 Client-Side FFT
The FFT was computed client-side using a Radix-2 algorithm. Calculation time was displayed on the dashboard after each capture. At this stage, amplitude was reported in voltage. The system can be extended to calibrated acceleration units or decibel-based reporting for specific applications.
Area
Results
Pre-Impact Data
Circular buffer preserved baseline data before every trigger event
Trigger Reliability
Threshold control rejected handling disturbance and background vibration
Impact Comparison
Three impact objects compared under identical conditions on the same specimen
Bounce Detection
Secondary contact appeared as a separate event in the time-domain waveform
Frequency Response
Dominant frequency peak identified and displayed automatically after each capture
Dashboard Control
Engineers adjusted all capture parameters directly from the test bench
Modularity
Specimen, sensor position, and impact method all changeable without system modification
Recording started after the trigger, missing the start of the impact
Circular buffer captured pre-impact baseline and full strike
No reliable way to reject false triggers from handling vibration
Adjustable threshold filtered out disturbance without missing real impacts
Different impact objects could not be compared under controlled conditions
All three objects tested on the same specimen at the same location with the same settings
Bounce and secondary contact were not visible in the data
Secondary events appeared as distinct peaks in the time-domain waveform
FFT required manual post-processing after each capture
Frequency response computed and displayed automatically after every impact
Engineers had no single view of waveform and frequency response together
Dashboard showed both outputs side by side after each capture
The test bench gave engineers a controlled way to compare impact inputs on the same specimen.
That was the point.
Ontario Dynamics did not build a general-purpose data acquisition system. The final design was purpose-built for this problem: circular buffer capture, independent detection and recording channels, automatic FFT computation, and a dashboard that engineers could use directly at the test bench without a separate processing step
For product development work, that combination matters. Early-stage testing involves a lot of comparison, different objects, different geometries, different conditions. A system that captures the full impact signature and computes the frequency response in one step shortens that process and makes the results more reliable.
The project changed how impact testing could be conducted. Engineers no longer had to choose between capturing the start of the impact and having a reliable trigger. The circular buffer solved that directly.
The system also made bounce detection routine rather than exceptional. Any secondary contact event appeared in the waveform automatically. Engineers could see at a glance whether a test produced a clean single impact or multiple contacts, and decide whether to keep or discard the result.
For Ontario Dynamics, this project demonstrated that purpose-built test equipment, designed around a specific measurement problem, produces better data than general-purpose setups adapted to fit. The client had a working test bench, a reliable comparison methodology, and a dashboard they could operate independently from day one.
The single most important design decision was capturing data before the trigger, not after it. Without the circular buffer, the earliest part of every impact, the part that carries the most information, would have been lost on every test.
Using one accelerometer for detection and a second for recording kept the two functions independent. It prevented the impact signal from interfering with the trigger and gave each channel the right configuration for its job.
Same specimen. Same location. Same drop height. Same dashboard settings. The only variable between tests was the impact object. That level of control is what made the frequency response comparison valid.
Computing and displaying the FFT automatically after each capture meant engineers could review frequency data immediately. There was no separate processing step between the test and the result.
Because the system captured the full post-impact waveform, secondary contact events were visible without any additional instrumentation. That made impact quality assessment a standard part of every test rather than a separate procedure.
The test bench was designed around the specific demands of high-speed impact measurement. That focus, circular buffer, dual channels, automatic FFT, adjustable dashboard, produced a more capable and more practical system than adapting standard data acquisition hardware would have.


Services
Company